Table of Contents
Introduction
It is crucial for the management of a service provider company, to be able to view all important key figures about the company at any time. The "Finance" dashboard was provided for this purpose.
Via the navigation item "Overview / Finance" users with the role "Controlling" and/or "Accountant" can reach the Finance Dashboard, which is divided into two levels. On the first level, which requires the role "Controlling", there are the company key figures and a listing of business units with corresponding key figures. Selecting a business unit takes you to the second level with business unit key figures and different views of the key figures (order view, employee view, external provider view).
If a user only has the role "Accountant", he/she will get directly to the level of the company business units via the navigation item "Overview / Finance", as this role is not allowed to see the company key figures.
Finance Dashboard at Company Level
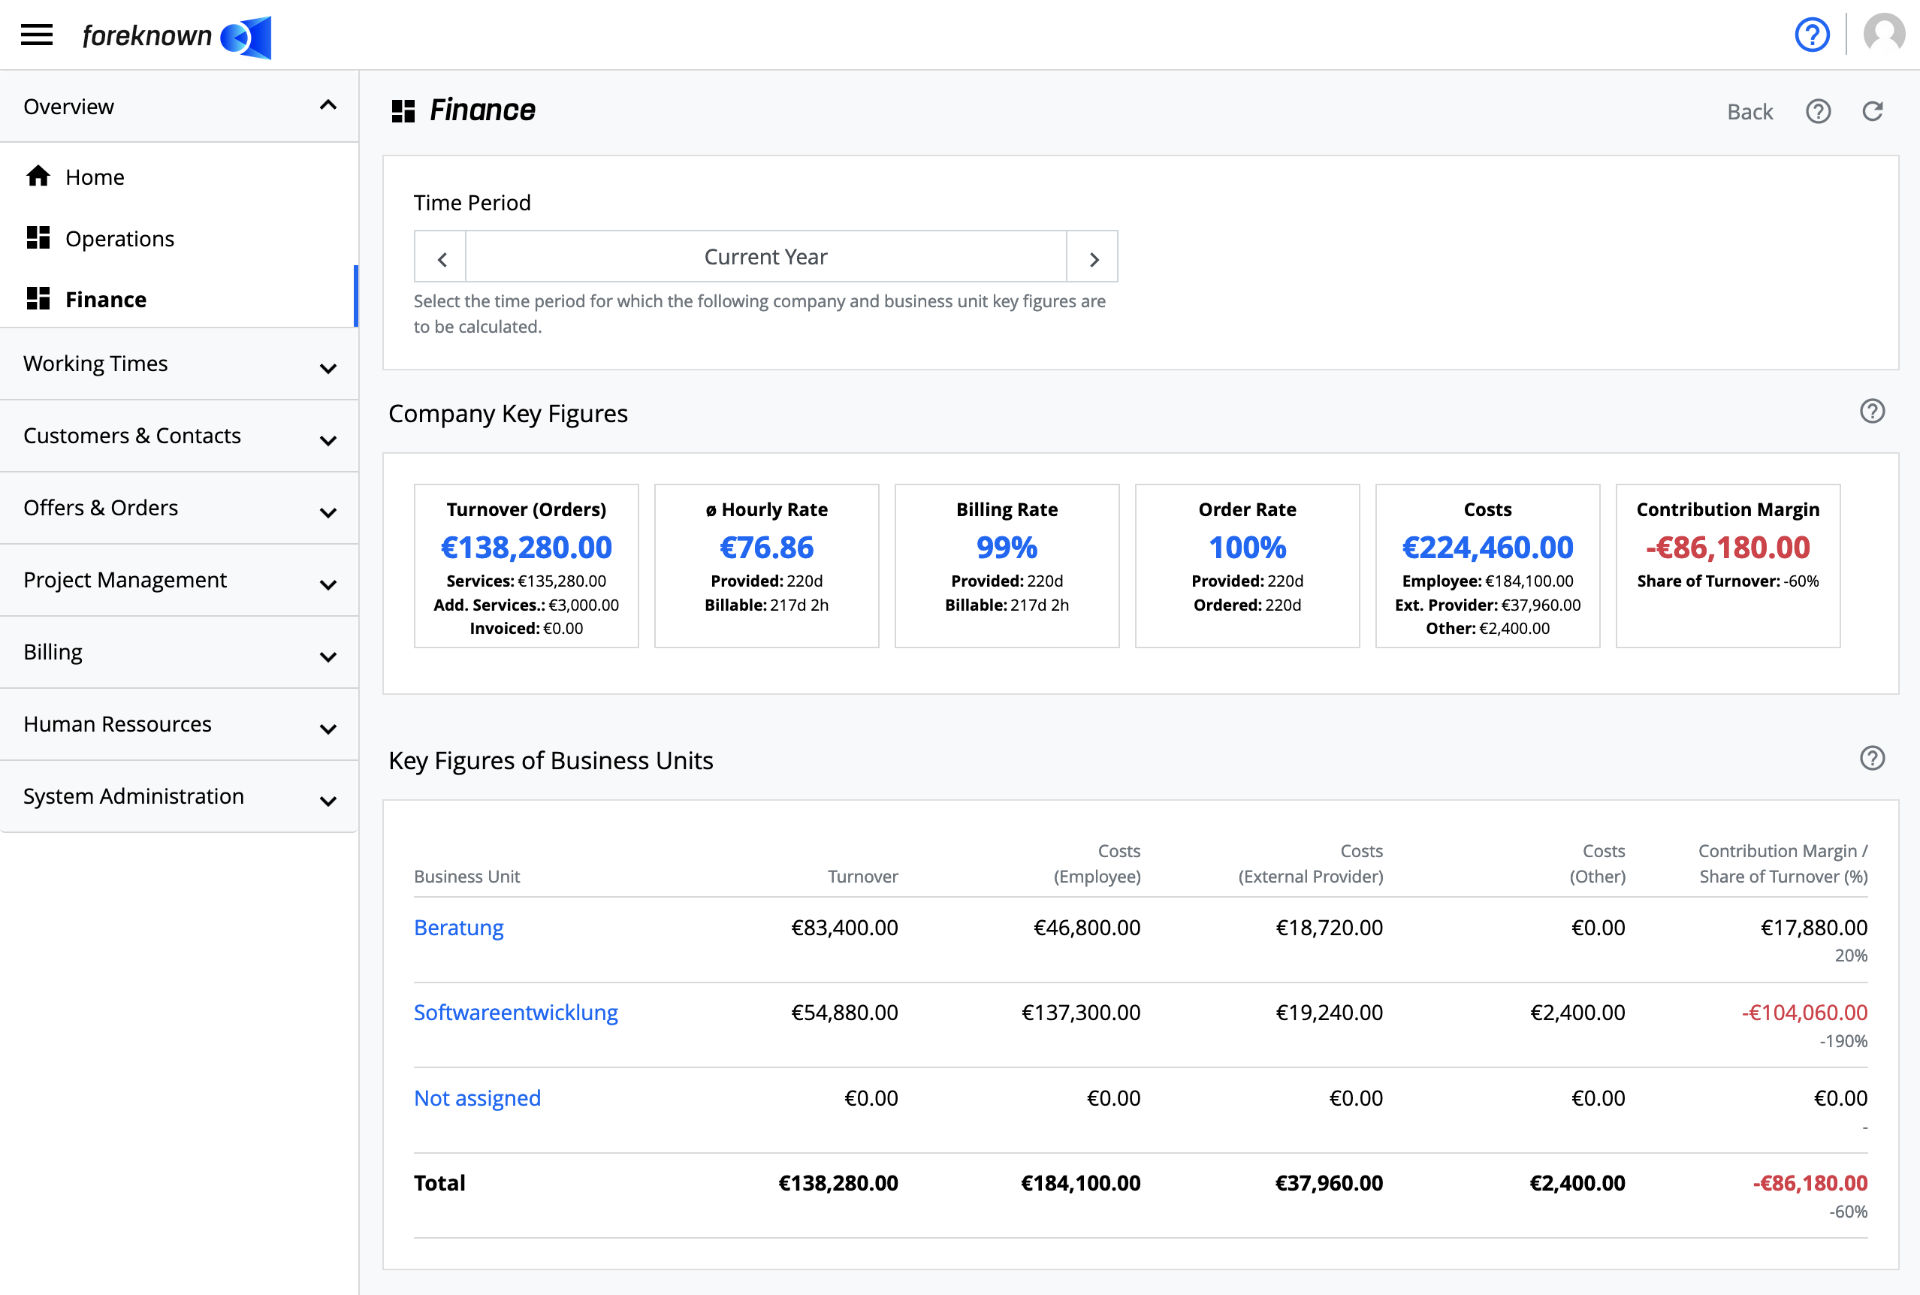
The first level of the "Finance" dashboard presents key figures at the company level. Furthermore, all company business units are listed in tabular form with essential key figures. By selecting a business unit you can access the "Finance Dashboard for Business Units".
Filter Options
The company key figures can be queried for any period. The period can be adjusted via the "Period- Input Field".
- Current day: Shows you the key figures of today.
- Current week: Shows you the key figures of the current week.
- Current month: Shows you the key figures of the current month.
- Current quarter: Shows you the key figures of the current quarter.
- Current year: Shows you the key figures of the current year.
- Period: Here you can define a period of time via a calendar selection field or by directly entering a date. freely.
By clicking on "Reset", the "Current year" option is selected again. Except for a freely selected period you can use the arrow keys right and left to jump back and forth between days, weeks, months, quarters and years.
Initially, the current year is preset as the time period.
NOTE: When selecting the period, it should be kept in mind that personnel costs are taken into account in accordance with the booking date (see Personnel Costs at Employee). Therefore, it is recommended to select the period always in full months to include all personnel costs of a month. Otherwise, the result could look better, because for the last month the personnel costs were not included.
Company Key Figures
The "Company Key Figures" section shows you important key figures such as turnover, average hourly rate, billing rate, order rate, costs and contribution margin for the selected period.
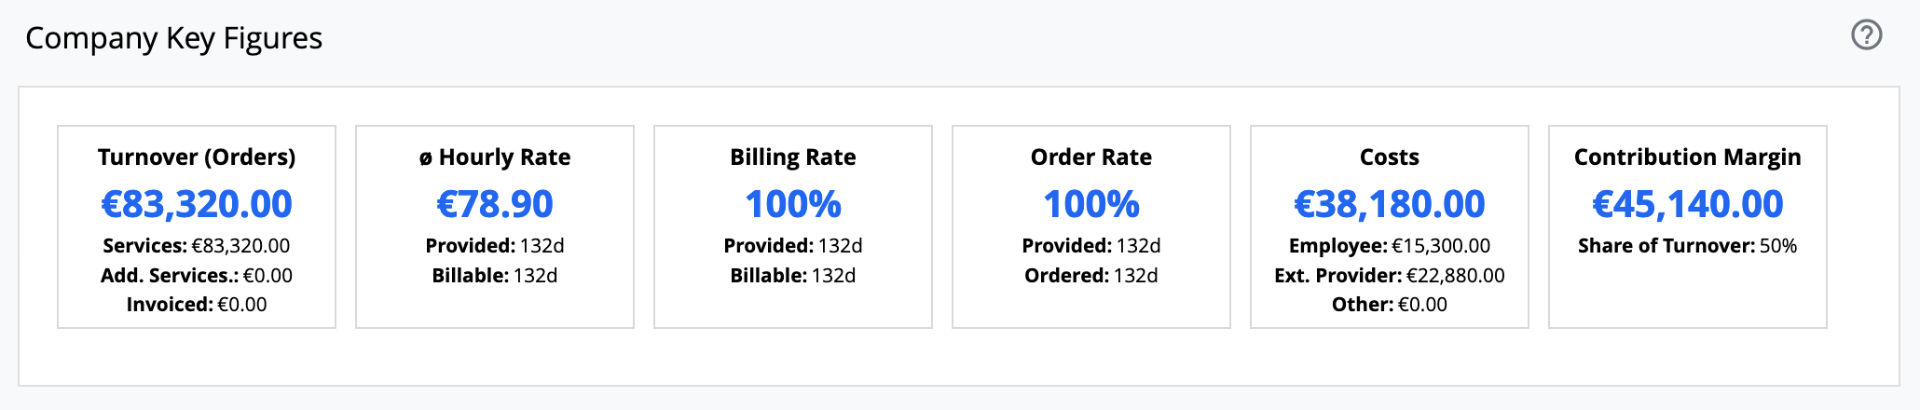
The individual key figures are described in more detail below.
Turnover (Orders)
Here you get the sum of all billable services and additional services, which result from all orders of the company for the selected. Below the sum the following details are displayed:
- Services: Displays the portion of revenue that results from the sum of all billable services which in turn have arisen from activity bookings.
- Additional Services: Displays the share of revenue calculated from the total of additional services (e.g. travel expenses, payments on account).
- Invoiced: Displays the portion of the turnover that has already been invoiced in the selected period.
If you use more than one currency in your company, a separate box will appear for each currency with a turnover in the corresponding currency.
IMPORTANT: The turnover figures do not give any information about whether the turnover has actually been generated in the company or will be generated. It is a projected turnover.
Average Hourly Rate
The average hourly rate is calculated as the sum of the duration of all booked activities (billable and non-billable) and the revenue for the selected period under review. Below the ø hourly rate the following details are displayed:
- Booked: Shows the sum of the duration of all booked activities (billable and non-billable) of the selected period in days, hours and minutes.
- Billable: Displays the sum of the duration of all booked, billable activities of the selected period in days, hours and minutes.
If you use multiple currencies in your company, each currency will have its own box with an average hourly rate.
Billing Rate
The billing rate shows the percentage of billable services in relation to the total number of services booked for the selected period. The following details are displayed below the billing rate:
- Booked: Shows the sum of the duration of all billable and non-billable services of the selected period in days, hours, and minutes.
- Billable: Shows the sum of the duration of all billable services of the selected period in days, hours, and minutes.
Order Rate
The order rate shows the percentage of services booked on sales orders in relation to the total services performed in the selected period. Below the order rate the following details are displayed:
- Booked: Shows the sum of the duration of all billable and non-billable services of the selected period in days, hours, and minutes.
- Ordered: Displays the total of all billable and non-billable services that have been assigned to sales orders for within the selected period in days, hours, and minutes.
Costs
This key figure shows the variable costs of the company that have arisen for the calculation of the contribution margin from personnel costs for employees, from third-party costs and other variable costs.
- Employees: Shows the total personnel costs for all employees for the selected period.
- External: Displays the sum of variable costs resulting from the hours booked by the external provider multiplied with the hourly cost rate of the external provider.
- Other: Displays the sum of costs booked via additional services.
Contribution Margin
This key figure shows the contribution margin of the company for the selected period, which is calculated as follows:
Contribution margin = sum of costs - turnover (orders).
Below the contribution margin, the percentage of the company's sales is displayed.
Business Unit Key Figures
Below the company key figures, the business unit key figures are displayed in tabular form. The prerequisite is that business units have previously been created as managers or personnel managers via "Human Resources / Business Units".
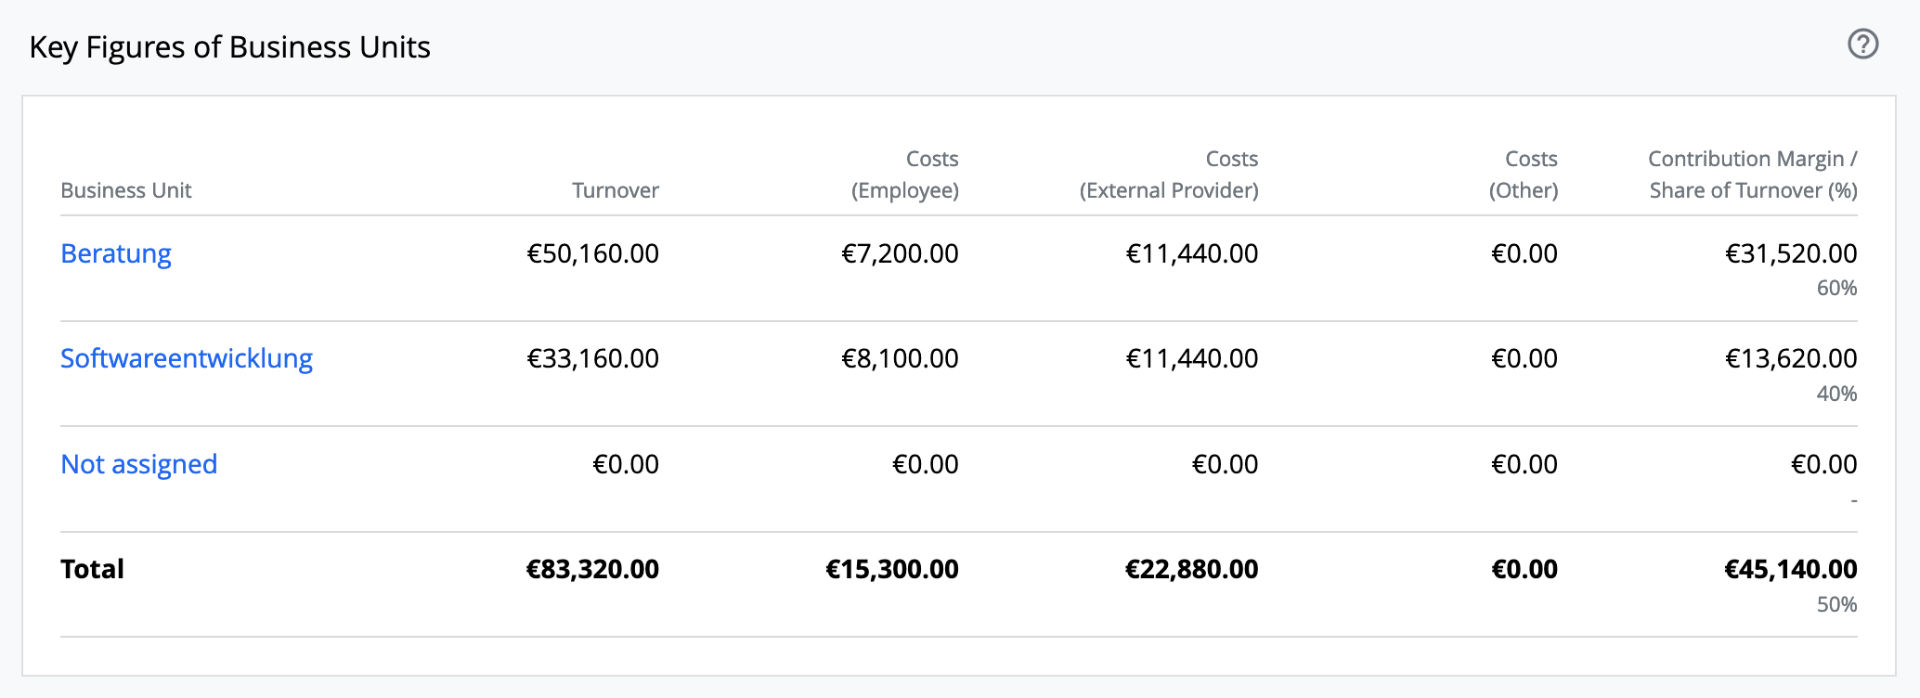
The following information is listed in the table:
- Business Unit: Name of the business unit. This is linked to the "Finance Dashboard on the business unit level" to get all KPIs of the business unit and further views on orders, employees and external providers.
- Turnover: Displays the turnover that have been generated for the business unit during the selected period due to billable services and additional services. It is therefore more of a potential turnover, since actual revenue is not generated until invoicing.
- Costs (employees): Shows the total costs incurred by the business unit in the selected period on the basis of personnel costs of all assigned employees.
- Costs (external providers): Displays the total costs calculated for the business unit in the selected period on the basis of the contractual contractual hourly rates and the booked activities of all assigned external providers.
- Costs (Other): Shows the sum of costs calculated from additional services performed in the selected period for the business unit.
- Contribution Margin / Share of Turnover (%): Displays the contribution margin calculated from the difference between turnover and all costs. In addition, the percentage share of the contribution margin in turnover is displayed.
In the last line, the totals per column are calculated. These values can be found in the company key figures described above under turnover (orders), costs and contribution margin.
As soon as turnover or costs are determined that cannot be assigned to any business unit, an additional line "Not assigned" is displayed. In this way, it can be quickly determined whether orders or employees and external providers are still missing assignments to business units. To do this, simply click on the "Not assigned" link to access the "Finance Dashboard at Business Unit Level".
Finance Dashboard at Business Unit Level
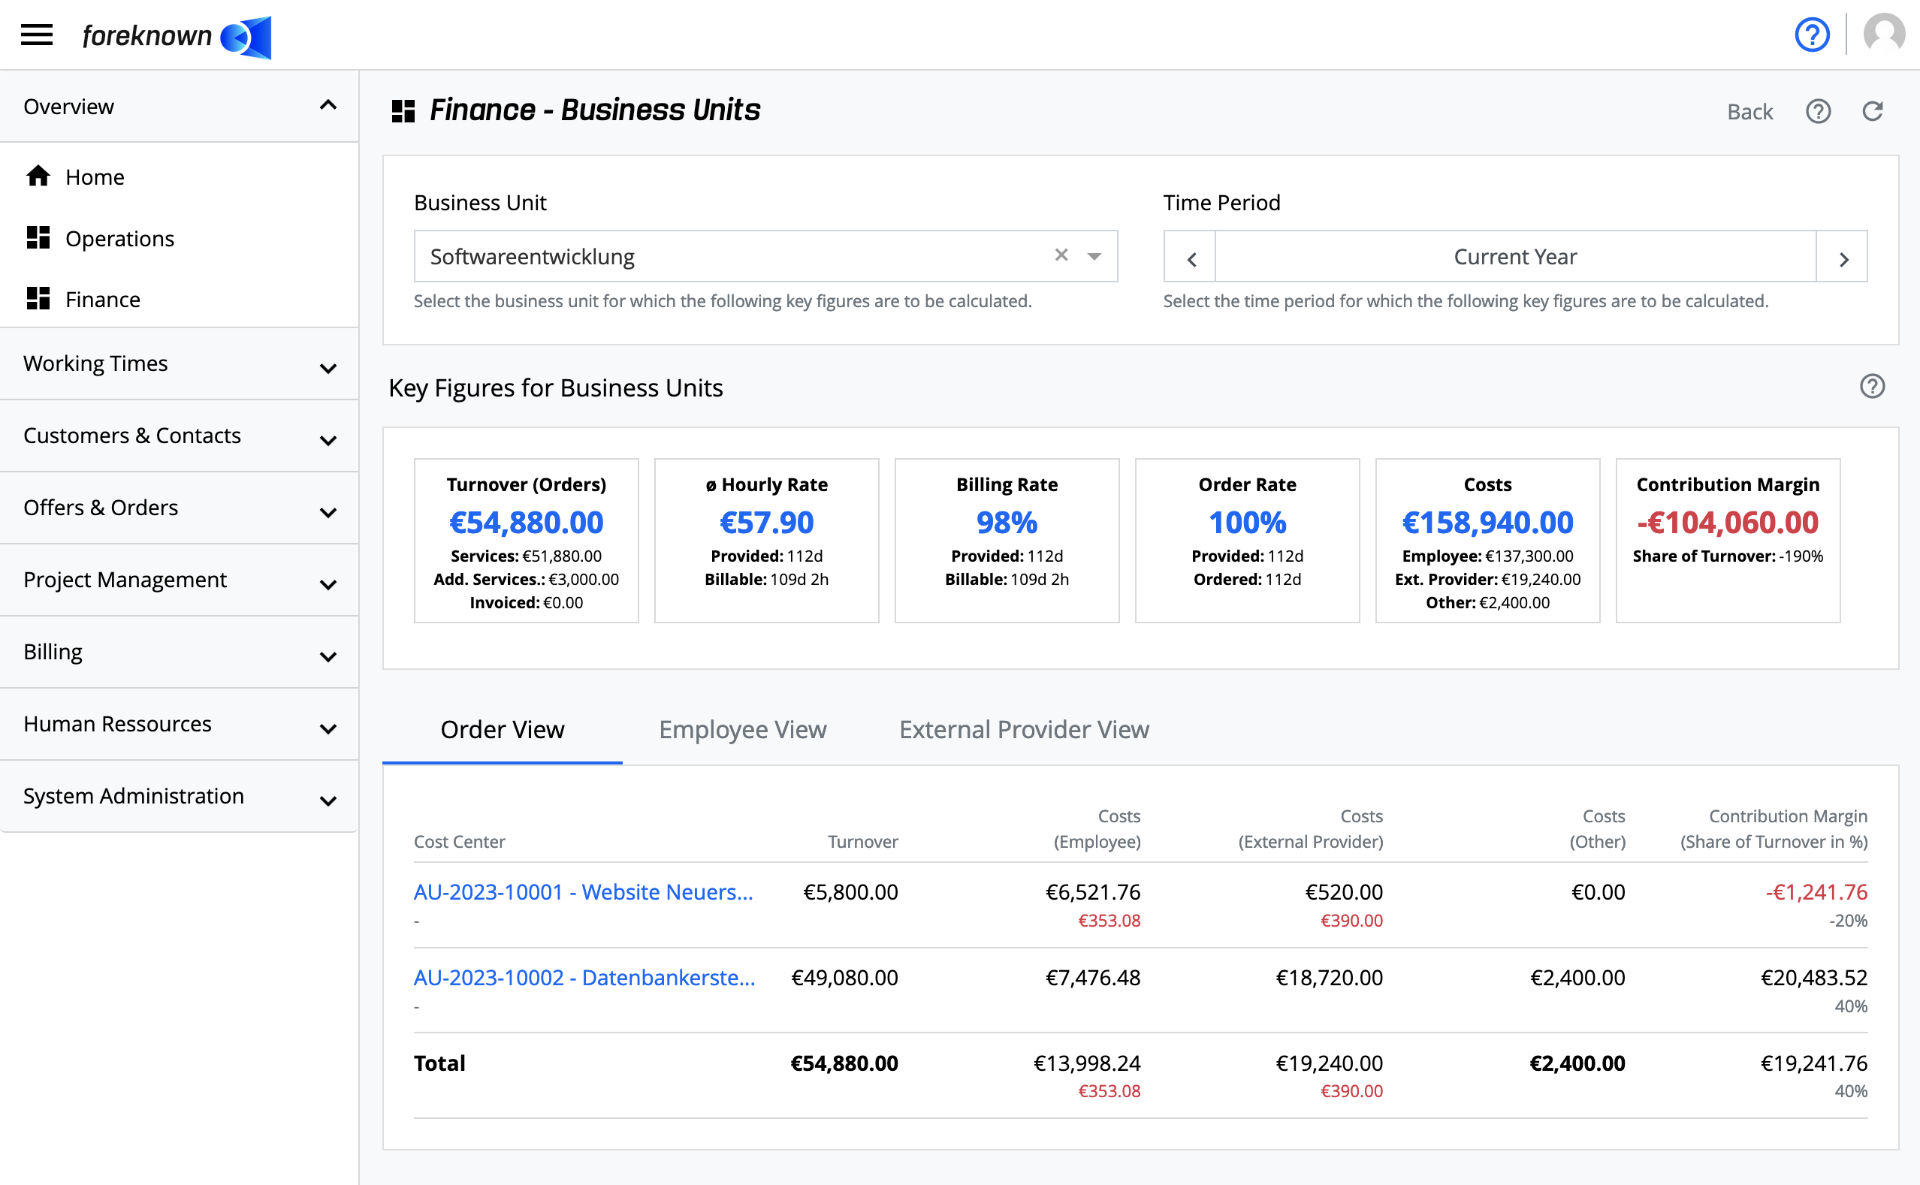
The "Finance Dashboard at Business Unit Level" can be accessed in two different ways. On the one hand user with the role "Controlling" can click on one of the listed business units via the "Finance Dashboard on Company Level". On the other hand, a user who only has the role "Manager" and is assigned to an business unit as a manager, will be redirected directly to this dashboard when accessing the navigation item "Overview / Finance".
Filter Options
If the current user has access to several business units, the selection field "Business Unit" can be used to switch between the areas.
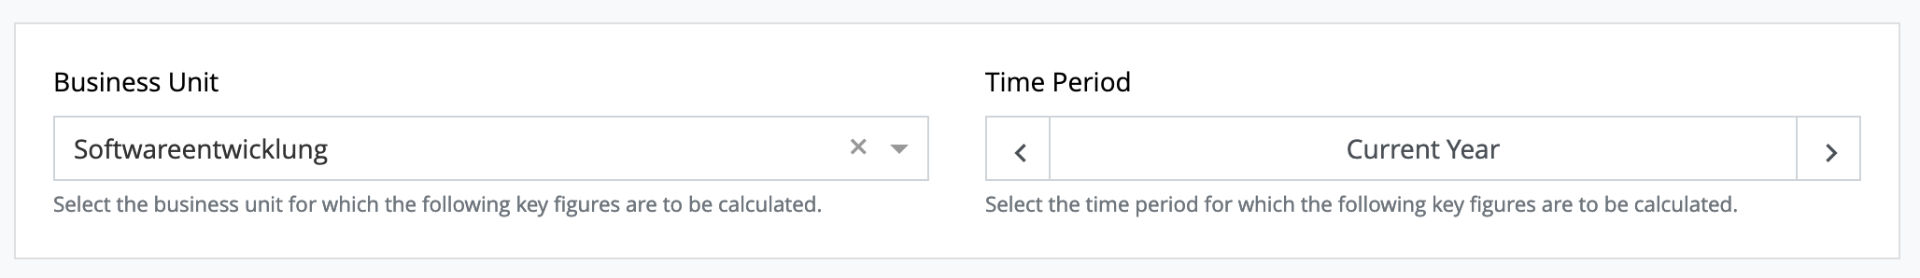
The busiess unit key figures can be queried for any period. The period can be adjusted via the "Period- Input Field".
- Current day: Shows you the key figures of today.
- Current week: Shows you the key figures of the current week.
- Current month: Shows you the key figures of the current month.
- Current quarter: Shows you the key figures of the current quarter.
- Current year: Shows you the key figures of the current year.
- Period: Here you can define a period of time via a calendar selection field or by directly entering a date. freely.
By clicking on "Reset", the "Current year" option is selected again. Except for a freely selected period you can use the arrow keys right and left to jump back and forth between days, weeks, months, quarters and years.
Initially, the current year is preset as the time period.
NOTE: When selecting the time period, please keep in mind that the personnel costs in the employee view are considered according to the booking date (see Personnel Costs at Employee). Therefore, it is recommended to, always select the period in full months to include all personnel costs of a month. Otherwise, the result could show up better, because for the last month the personnel costs were not included.
For the calculation of costs in the order and external provider view, however, an individual time period view is possible, as in this case all costs are calculated on the basis of the booked activities and the hourly rates that are specified in the employee contracts.
Business Unit Key Figures
As with the company key figures, some key figures for the selected business area are presented in KPI boxes.
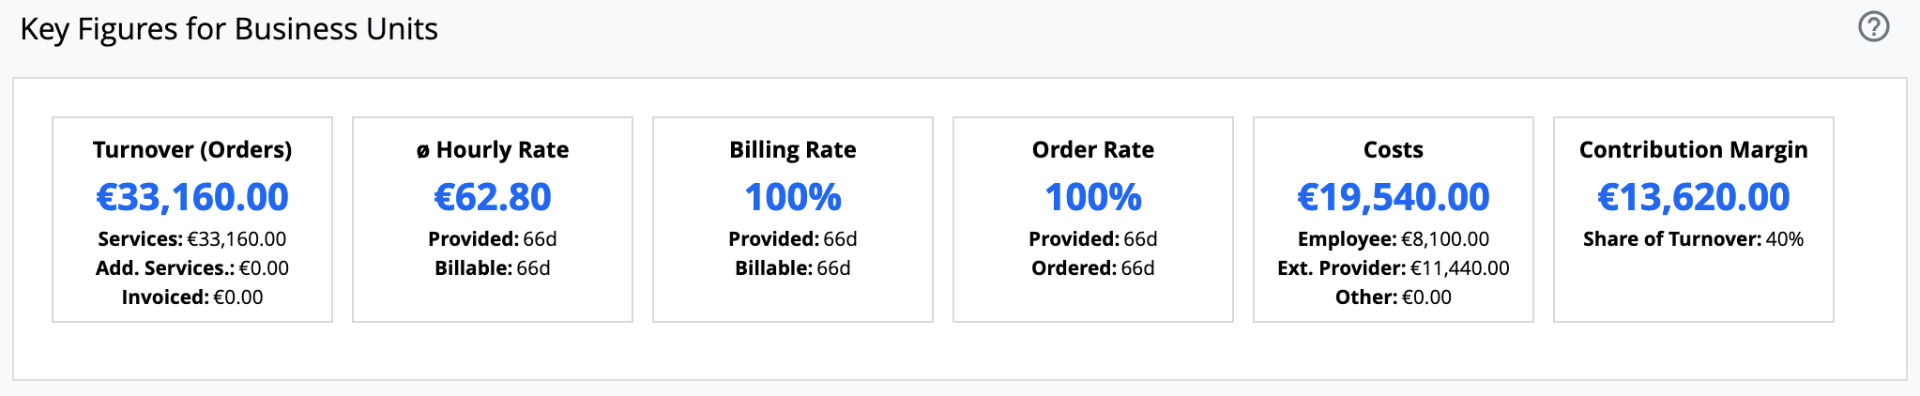
The only difference between these KPIs and the company KPIs is that they apply to a selected business unit of the company:
Note: Use the links to get details about the Kenzahlen.
Order View
Below the business unit key figures, there is the tab "Order View", which offers a list of all orders with the associated key figures.
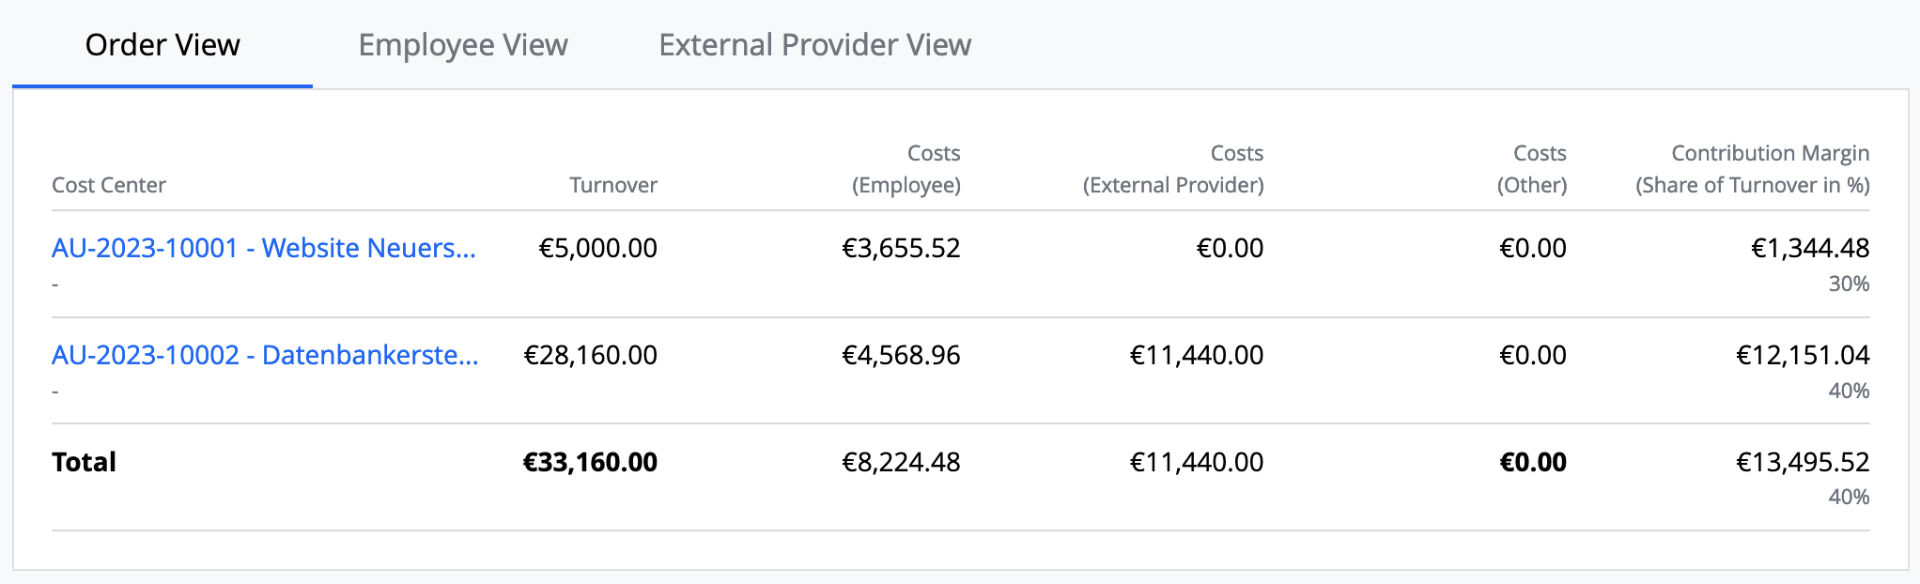
Only orders are displayed that have been assigned services in the selected time period. The following key figures are calculated for each order:
- Turnover: Shows the sum of all billable services that have been assigned to the order in the selected time period.
- Costs (Employees): Shows the sum of costs for employees. The costs are calculated on the basis of the imputed hourly rate calculated per employee contract based on the monthly salary specified. The duration is the sum of all billable and non-billable activities that were assigned to orders of the business unit during the time period.
- Costs (External Providers): Displays the sum of costs for external providers. The costs are calculated on the basis of the employee contract of the external provider. The duration is the sum of all billable and non-billable services that were assigned to orders of the business unit during the time period.
- Costs (Other): Displays the sum of costs resulting from additional services that were booked to orders of the business unit during the time period.
- Contribution Margin (% of Turnover): Shows the contribution margin generated from the order and a percentage of the turnover. This is calculated from the turnover minus all costs.
The first column "Cost Center" contains the order and, if applicable, a cost center number, if this has been maintained for the order. A link can be used to switch directly to the details of the order.
Employee View
Below the business unit key figures, there is the tab "Employee View", which offers a listing of employees of the business unit with associated key figures.
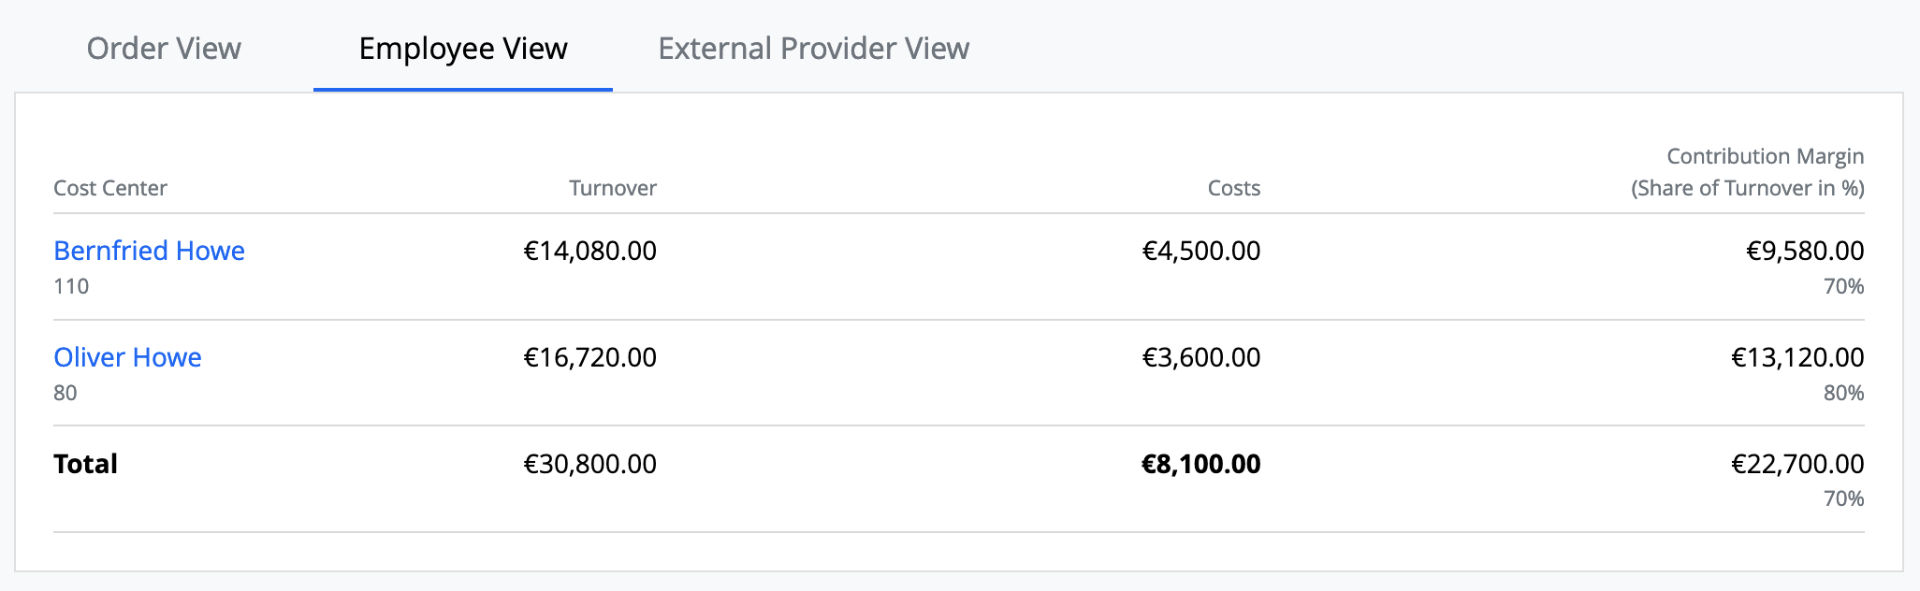
Only employees who have been assigned to the business unit in the selected time period are displayed.
- Turnover: Shows the total of all billable services performed by the employee in the selected period under review.
- Costs: Shows the employee's personnel costs that were posted in the period under review.
- Contribution Margin (share of turnover in %): Displays the contribution margin with a percentage share of turnover that an employee has generated in the selected time period. This is calculated from the turnover minus the costs.
The first column "Cost Center" contains the employee and a cost center number, if this has been maintained for the employee. A link can be used to switch directly to the details of the employee.
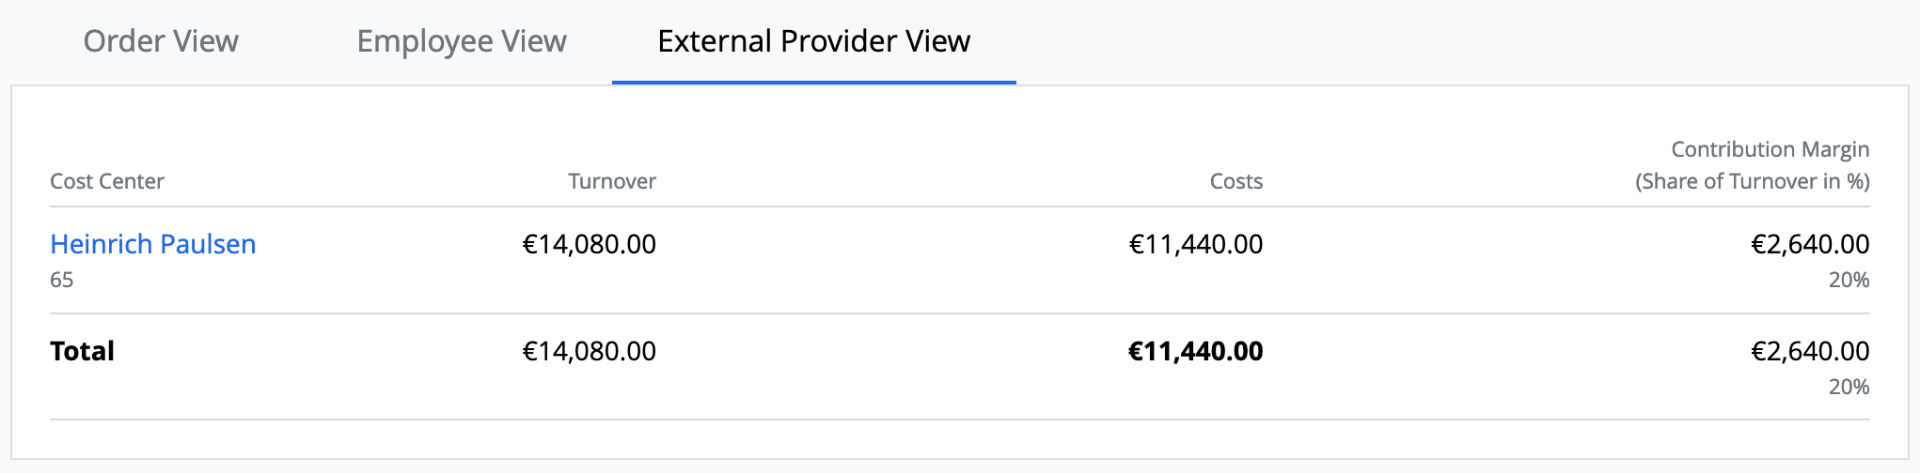
External Provider View
Below the business unit key figures, there is the tab "External Provider View", which offers a list of external providers of the business unit with the corresponding key figures.
Only external providers that were assigned to the business unit in the selected time period are displayed.
1 Turnover: Shows the total of all billable services provided by the external provider in the selected time period. 2. Costs: Shows the costs for the external provider that were posted in the time period. These are calculated from the duration of the services multiplied by the hourly rate of the external provider, which was deposited at the employee contract. 3. Contribution Margin (share of turnover in %): Shows the contribution margin with a percentage share of the turnover that an external provider has generated in the selecte time period. This is calculated from the turnover minus the costs.
The first column "Cost Center" contains the external provider and a cost center number, if this was maintained at the external provider. A link can be used to switch directly to the details of the external provider.